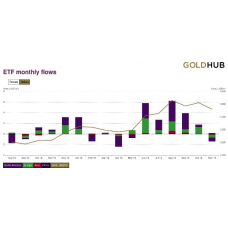
Gold ETFs lost 1% in November
Regional and fund-specific analysis of gold holdings and flows in USD: Gold-backed ETFs and similar products account for a significant part of the gold market, with institutional and individual investors using them to implement many of their investment strategies.
Flows in ETFs often highlight short-term and long-term opinions and desires to holding gold. The data on this page tracks gold held in physical form by open-ended ETFs and other products such as close-end funds, and mutual funds. Most funds included in this list are fully backed by physical gold.
Gold-backed ETFs lost 1% of holdings in November following five months of strong inflows: In November, global gold-backed ETFs and similar products saw US$1.3bn of net outflows across North America, Europe and Asia, decreasing their collective gold holdings by 30.1 tonnes(t) after reaching record highs in October. Global gold-backed assets under management (AUM) have grown 35% this year as a result of increased investment demand and price appreciation.
In November, North American funds led regional outflows, losing 17.3t (US$731mn, 1.1% AUM), as the US dollar strengthened and stock markets reached all-time highs on the strongest monthly performance since June. European fund outflows (US$538mn, 0.9%) were driven primarily by UK-based funds, which lost 18.8t (US$871mn, 3.2%) as the Brexit deadline extension prompted a reversal in the protective inflows of October.
Asian funds lost 2.1t (US$119mn, 3.1%), a result of outflows in China. Funds in Other regions grew 7.6% with a sharp increase in the holdings of a South African gold-backed ETF.
Although gold fell below US$1,500/oz (LBMA: US$1,460/oz) – decreasing 3.4% on the month and bringing the total return of gold to 14% y-t-d – it remains near all-time highs in every major G10 currency apart from the US dollar and Swiss franc. The risk-on environment, coupled with higher rates and easing geopolitical tensions, were headwinds for the price of gold. Yet, gold-backed inflows in 2019 remain a large driver of gold demand this year.
Global trading volumes rose to US$170bn per day in November, from US$156bn per day in October, which is 49% above the 2018 daily average. COMEX volumes rose to y-t-d highs of US$67bn a day as futures options volumes increased. There were large notable long-dated call purchases in gold options, demonstrating a bullish attitude.
Many of the larger trades were significantly out-of-the-money and will require large moves in the price of gold if profitability is to be achieved on expiration. However, many of these trades are likely volatility-related, with investors betting on increased future gold price volatility.
Expectations for future US Federal Reserve interest rate cuts continued to fall in November and this too weighed on gold price sentiment. There is some uncertainty surrounding 2020 Fed expectations, with current probabilities of only one rate cut next year, and that is not expected until at least the second quarter. As discussed in our Mid-year gold outlook 2019, gold price performance is likely to be impacted by uncertainty around monetary policy direction.
Risky assets continued to “melt up” in November as perceived market impacting events like the US/China trade deal and Brexit have been pushed out into 2020. The lack of market risk concerns is highlighted by VIX future positioning, which is at all-time short levels, a sign of extreme bullish market sentiment. At times, historically, significant short positioning has preceded sharp stock market sell-offs and subsequent rallies in the price of gold.
Despite the pullback in the price of gold, market positioning remains positive as COMEX net longs† remain near all-time highs, well above long-term averages. And with over 70% of sovereign debt trading with negative real rates, the opportunity cost of investing in gold has improved. We have researched the positive impact of lower rates on gold prices as well as the potential for additional gold exposure (potentially replacing bonds) in a low-rate environment.


